
Visualize Grating Regions in Lightguide Results
Abstract
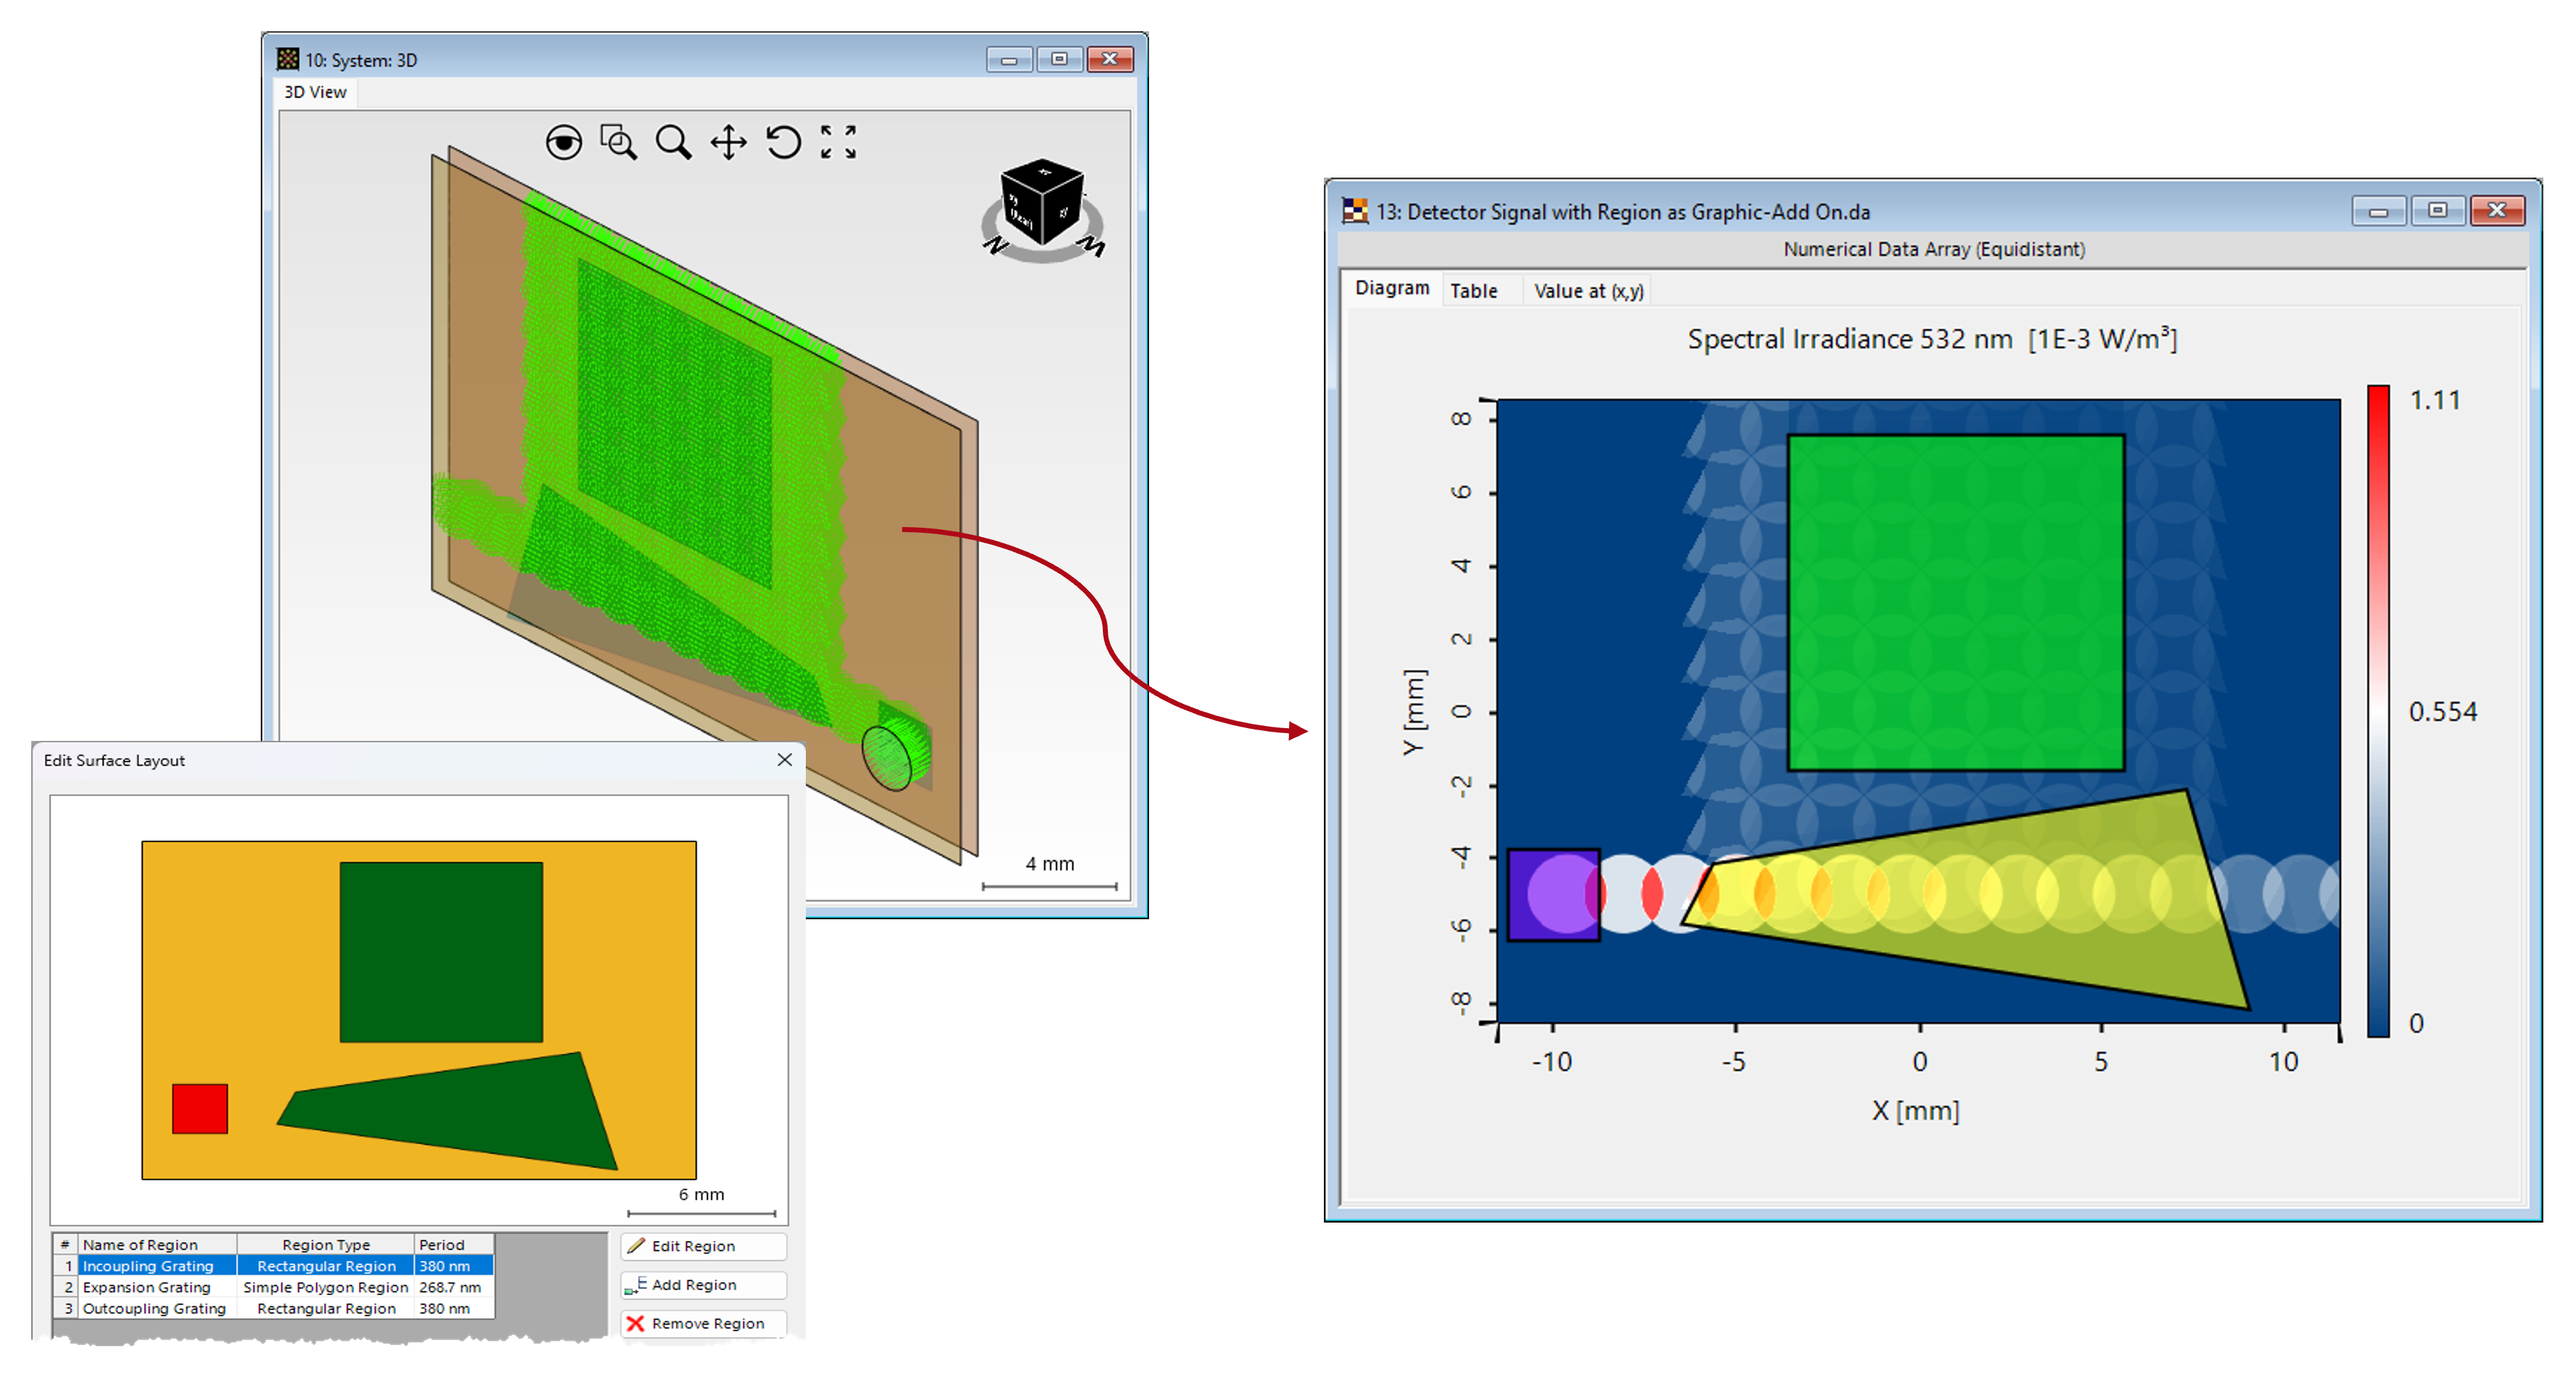
Lightguide systems based on surface relief gratings for augmented- and mixed-reality (AR/MR) applications are currently one of the hottest topics. These systems are known for their large number of free parameters as well as mixing of spectral and angular modes, making any design process challenging. To assist the optical engineer in this task, VirtualLab Fusion offers numerous analysis and visualization tools that provide deeper insight into the behavior of the system.
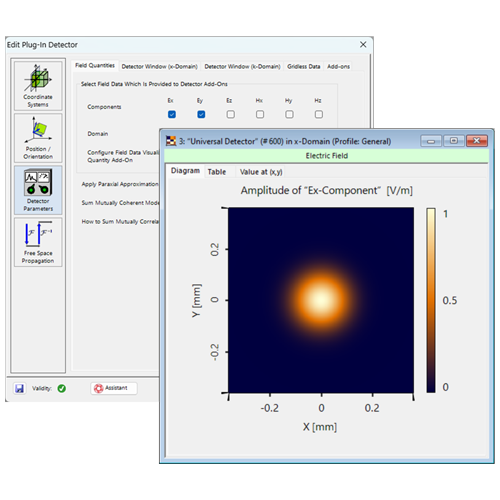
In this tutorial, we present a detector add-on for the Universal Detector that allows the visualization of grating regions (such as incoupler, outcoupler, and eye-pupil expander) directly on field data.
VirtualLab Fusion Configuration
-
 VirtualLab Fusion
-
 AR VR MR Package
-
 Grating Package
Are you interested in further reading?
Tutorial
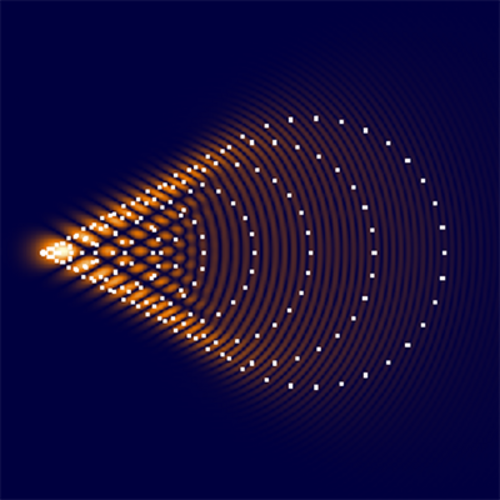
Add Point Cloud to Data Arrays
This tutorial shows how to overlay a point cloud (e.g. a dot diagram) onto another result document (e.g. an electromagnetic field result).
Tutorial
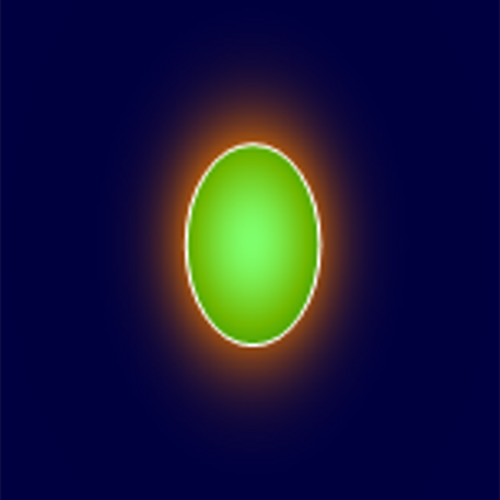
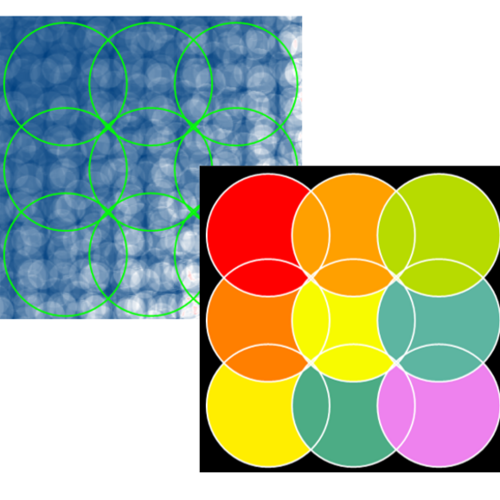
Add Region to Data Arrays
Graphics Add-Ons are a tool inside VirtualLab Fusion that allows the overlay of information, such as regions, onto a Data Array.
Tutorial
Graphic Add-Ons
Graphics Add-Ons are a tool inside VirtualLab Fusion that allows you to overlay information, such as point clouds.
Tutorial
Plug-In Detector
This document introduces the Plug-In Detector, which allows to evaluate and output any information of an electromagnetic field in VirtualLab Fusion.
Tutorial
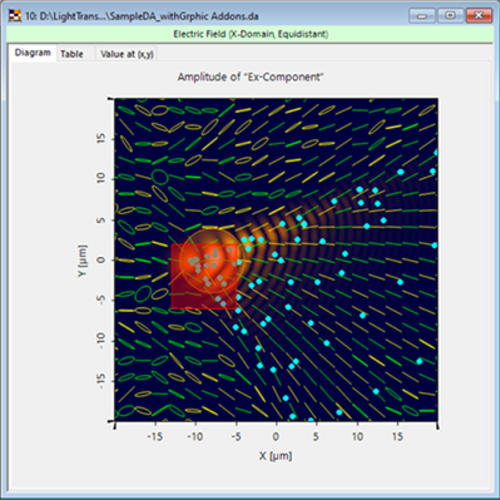
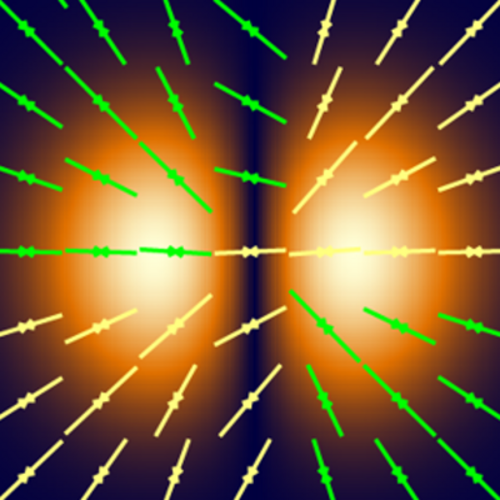
Polarization Ellipses
This tutorial shows how to visualize the polarization state of light, represented as complex electromagnetic wave in a depictive way.
Tutorial
Uniformity Detector for Lightguide Systems
This tutorial shows how to use the uniformity detector in VirtualLab Fusion.