
Graphic Add-Ons
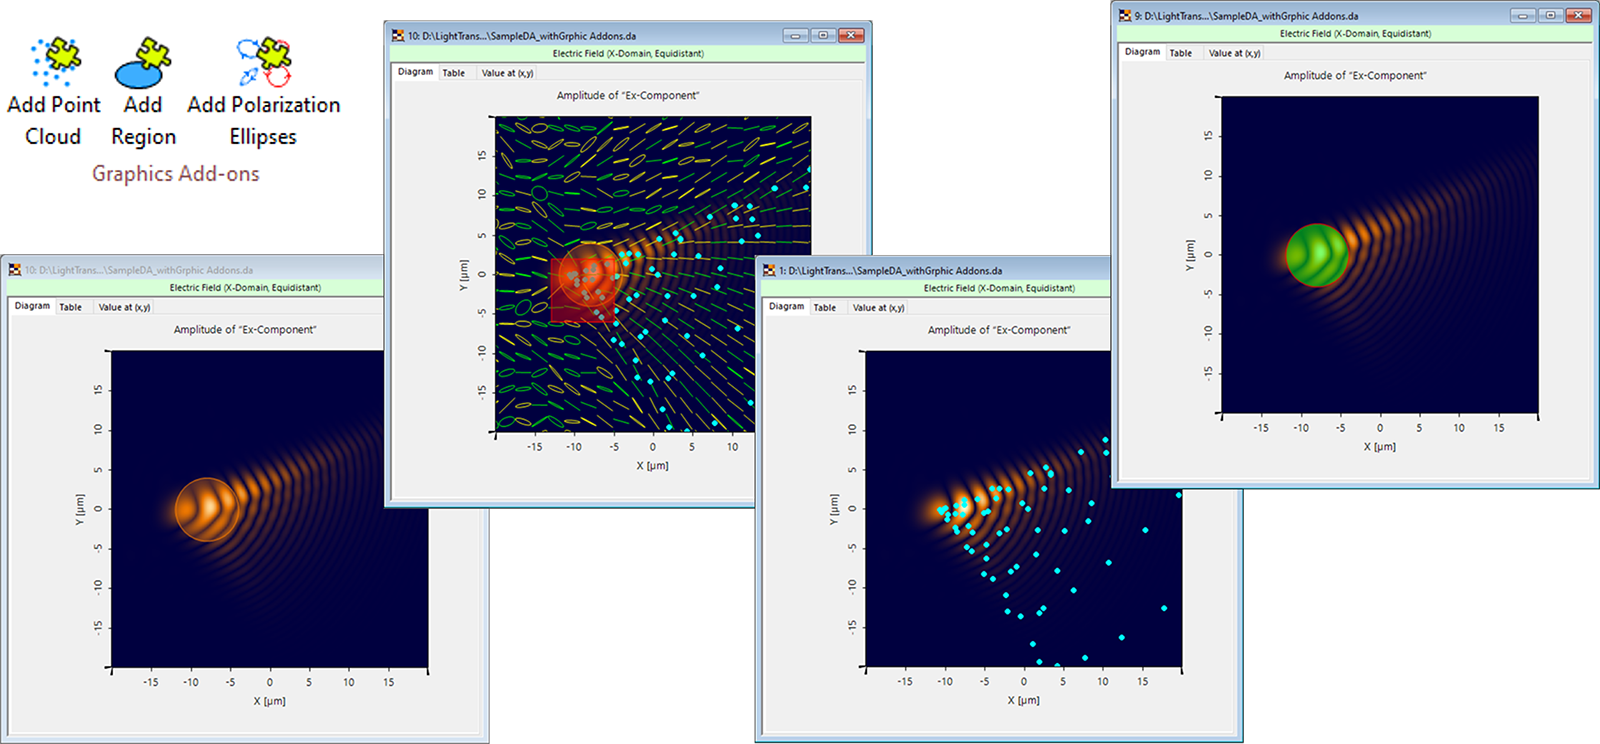
While the fast and accurate provision of simulation results is the main purpose of any optical simulation software, the ability to customize the visualization of the results should not be underestimated. Therefore, VirtualLab Fusion provides the user with a set of tools to help adding meaningful information to the raw numerical data. In this use case we want to put the spotlight on the Graphics Add-Ons, allowing the user to overlay a field result with various forms of additional information, such as point clouds, specific regions or visualizations of polarization ellipses.
VirtualLab Fusion Configuration
-
 VirtualLab Fusion
Are you interested in further reading?
Tutorial
Add Point Cloud to Data Arrays
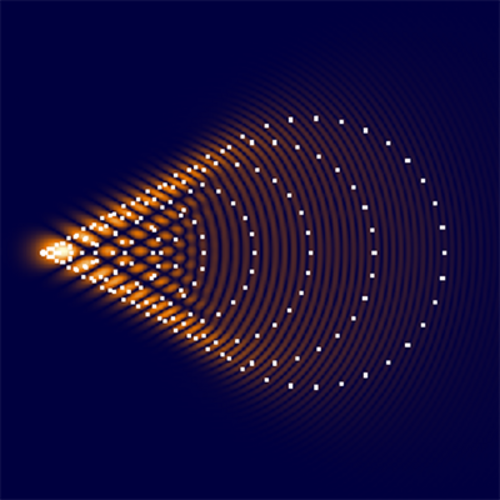
This tutorial shows how to overlay a point cloud (e.g. a dot diagram) onto another result document (e.g. an electromagnetic field result).
Tutorial
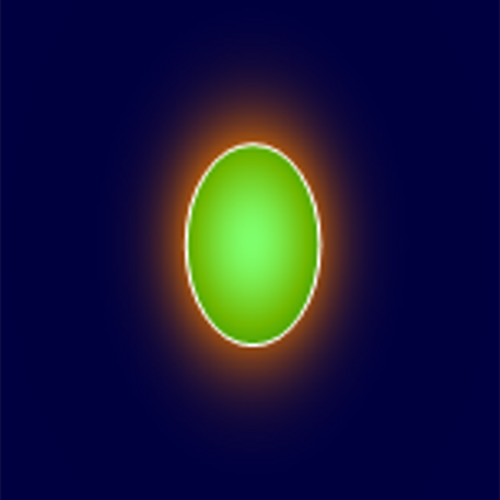
Add Region to Data Arrays
Graphics Add-Ons are a tool inside VirtualLab Fusion that allows the overlay of information, such as regions, onto a Data Array.