
3D Visualization of the Optical System
Abstract
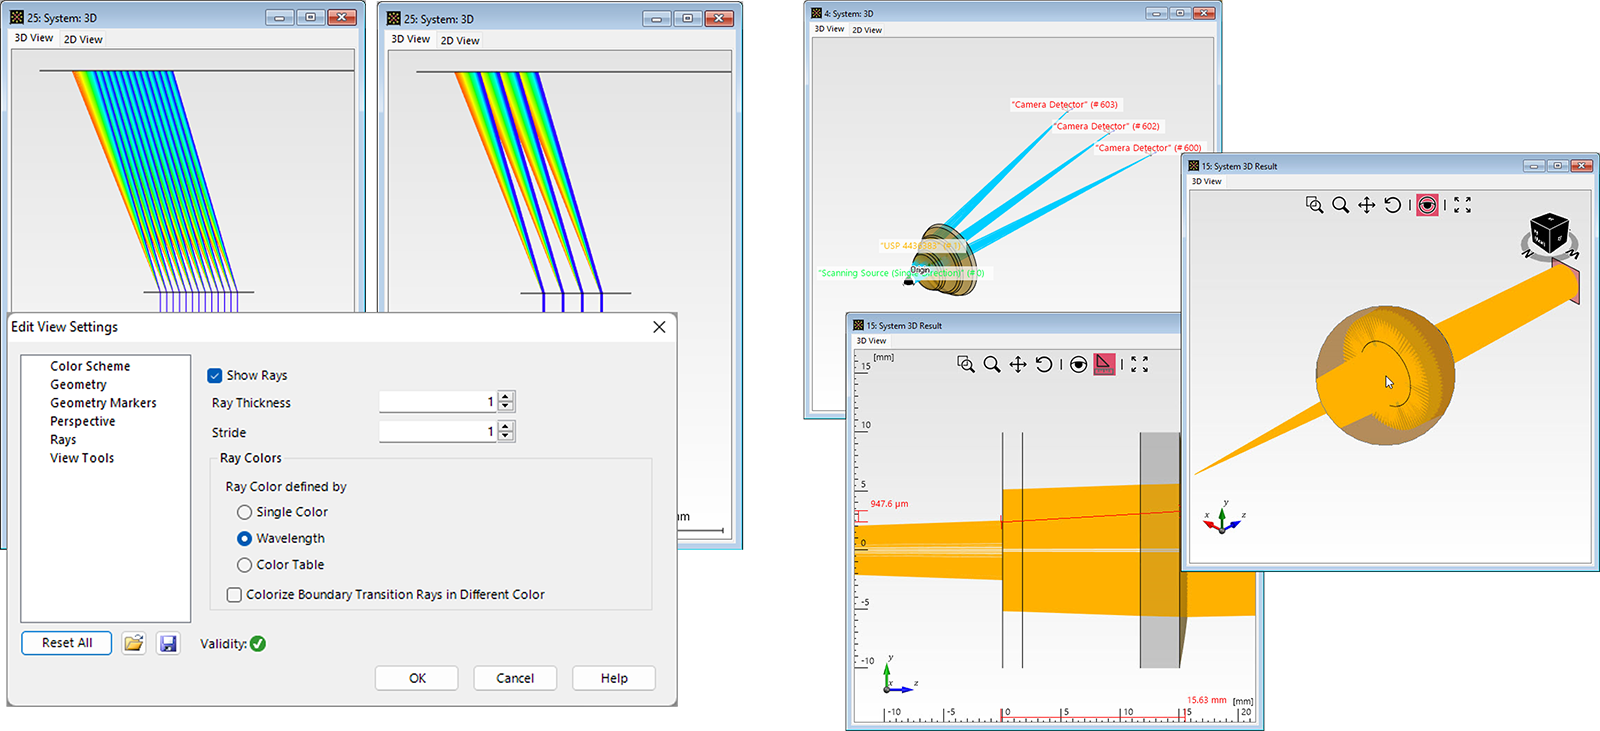
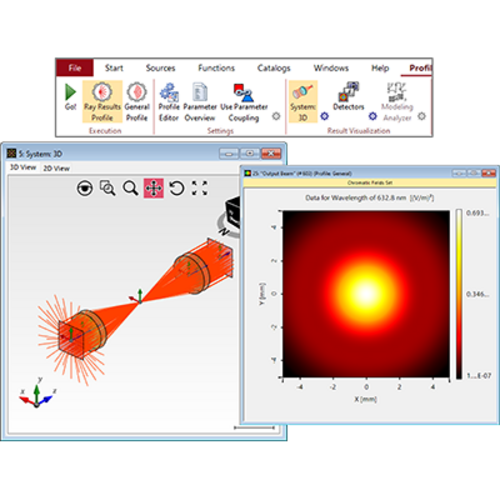
For a fundamental understanding of the properties of an optical system, a visualization of its components together with an indication of the light propagation is immensely helpful. For this purpose, VirtualLab Fusion provides tools which display a three-dimensional visualization of optical systems. These tools can further be used to check the positions of elements and detectors, as well as to get a quick overview of the light propagation inside the system. The applied modeling technique for the 3D view is similar to ray tracing.
VirtualLab Fusion Configuration
-
 VirtualLab Fusion
Are you interested in further reading:
Tutorial
Configuring Your Simulation in VirtualLab Fusion
This tutorial gives an overview of the different options and tools a user has access to when working with an Optical Setup file.
Use Case
Performance Evaluation of an F-Theta Scanning Lens
With the scanning source in VirtualLab Fusion, we analyze the performance of an F-Theta lens, by measuring the focal spot position deviation and the spot size for different scan angles.
Use Case
Investigation of Sodium D Lines with a Fabry-Pérot Etalon
An optical metrology system with a silica spaced etalon is set up to measure the sodium D lines in the optical design software VirtualLab Fusion.