
Creating 1D-Diagrams in VirtualLab Fusion
Abstract
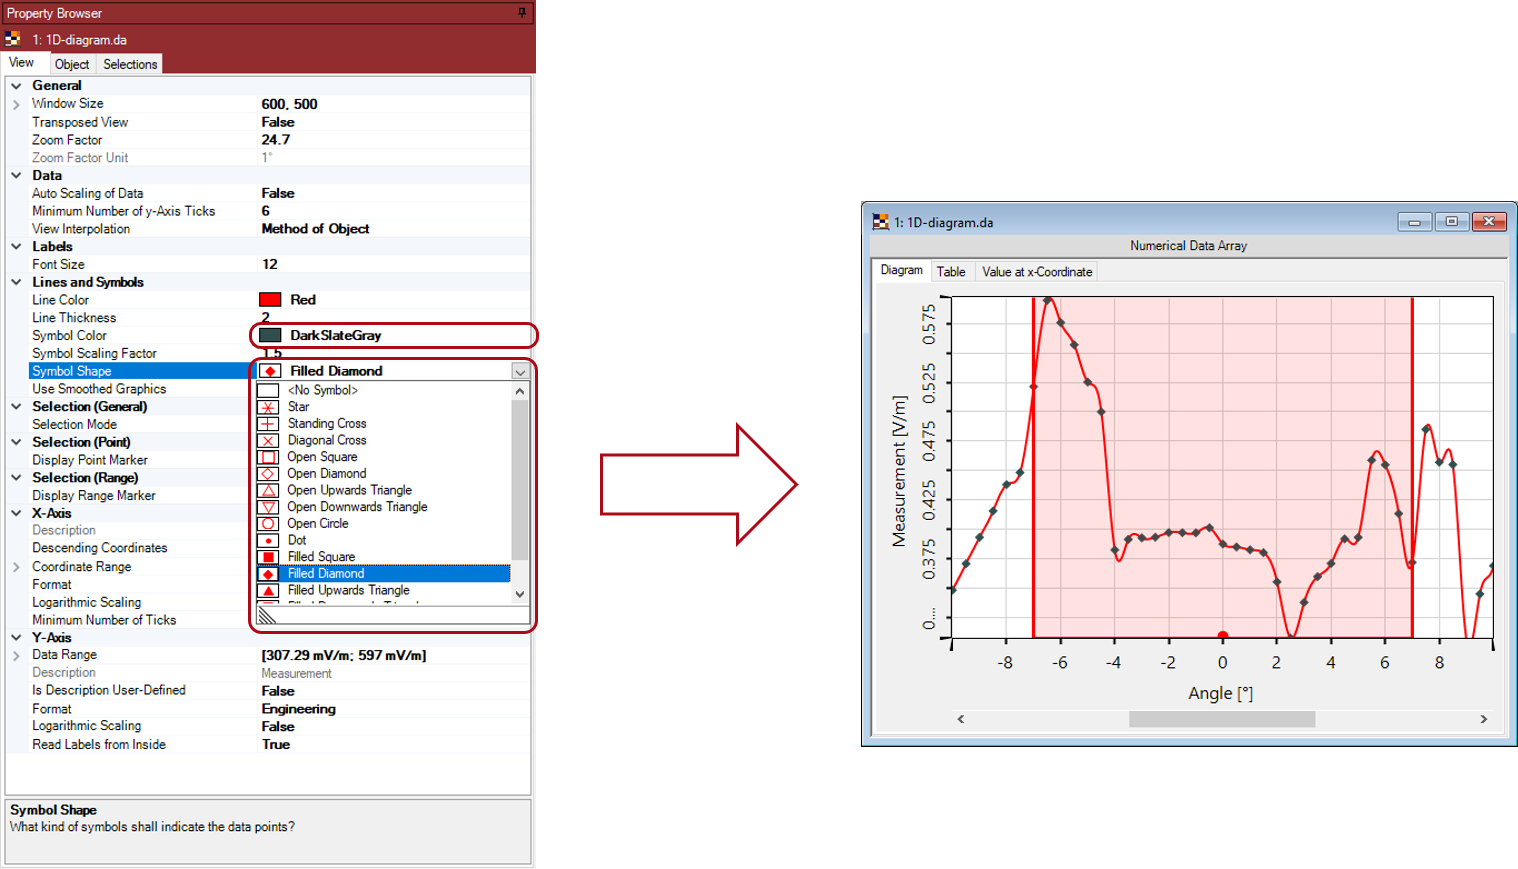
This use case demonstrates how to configure 1D diagrams in a way that meets the demands of an appealing presentation. VirtualLab Fusion enables the users to tune various ranging from axis names and units to interpolation and color schemes. In other words, all settings are configured on the GUI level which allows users without programming experience to generate 1D plot with arbitrary settings.
Downloads
VirtualLab Fusion Configuration
-
 VirtualLab Fusion