
Extend Zoom Window
Data Restricted Zoom
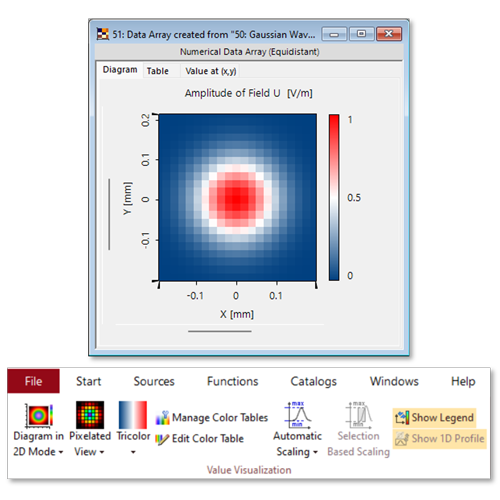
By default, VirtualLab Fusion (VLF) shows results (e.g., fields) in an area defined by the customer or automatically chosen by VLF (e.g., the detector window size), and you can zoom into but not out of this area. That is because, by default Data Restricted Zoom (in View ribbon, see figure 1) is activated. When Data Restricted Zoom is deactivated, you can extend the zoom beyond the size of the data window.
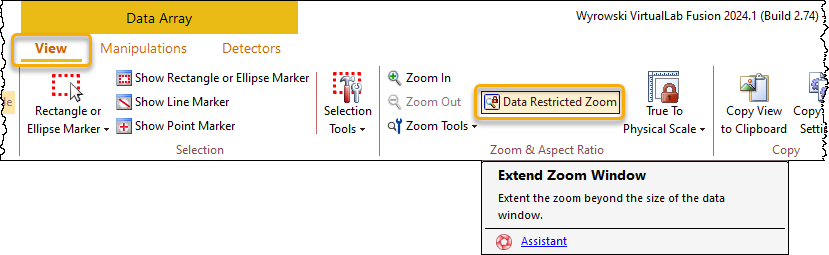
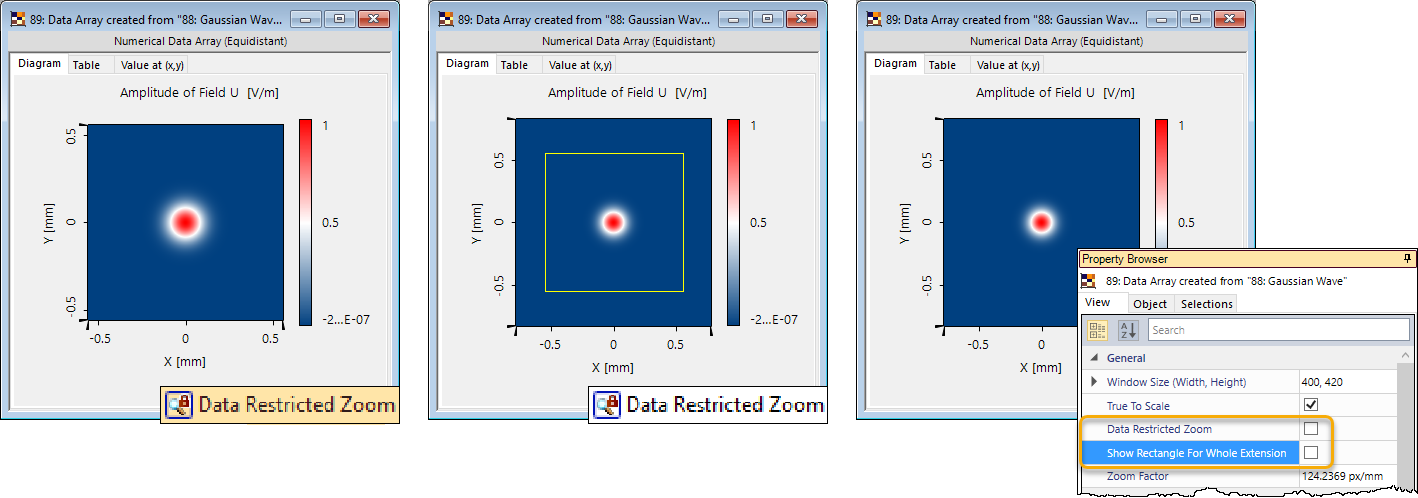
Figure 2 compares a field where this option was used so that zooming out was also possible. By default the actual data window is indicated by a rectangular marker. This indication can be deactivated by unchecking the option Show Rectangle for Whole Extension in the Property Browser.
Examples Where Data Restricted Zoom Might Be Useful
Truncated Dots
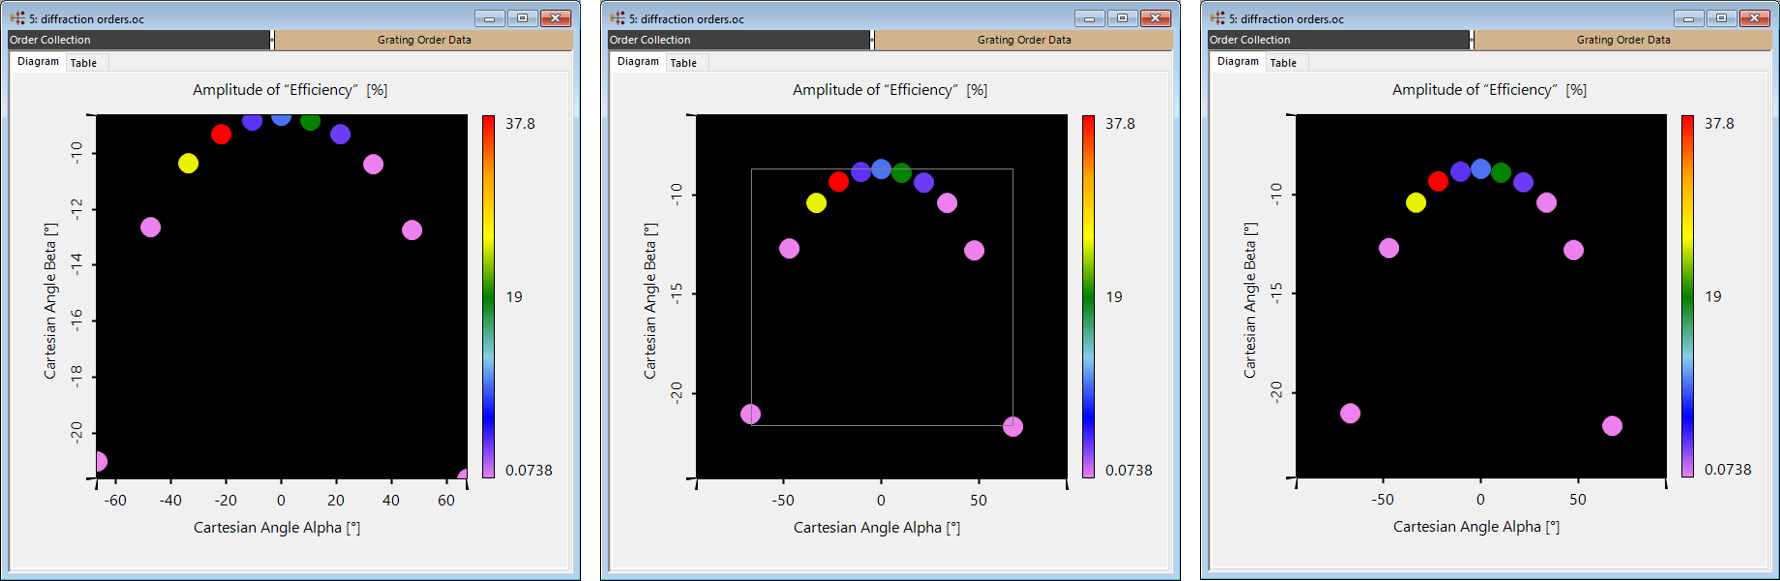
The Order Collection result from the Grating Package might output results where it is disturbing, that the dots indicating values of diffraction orders are truncated (figure 3 left). Deactivating Data Restricted Zoom allows to zoom a bit out, getting rid of this “problem” halfway (figure 3 middle). By deactivating the option Show Rectangle for Whole Extension the result can be seen in its full beauty (figure 4 right).
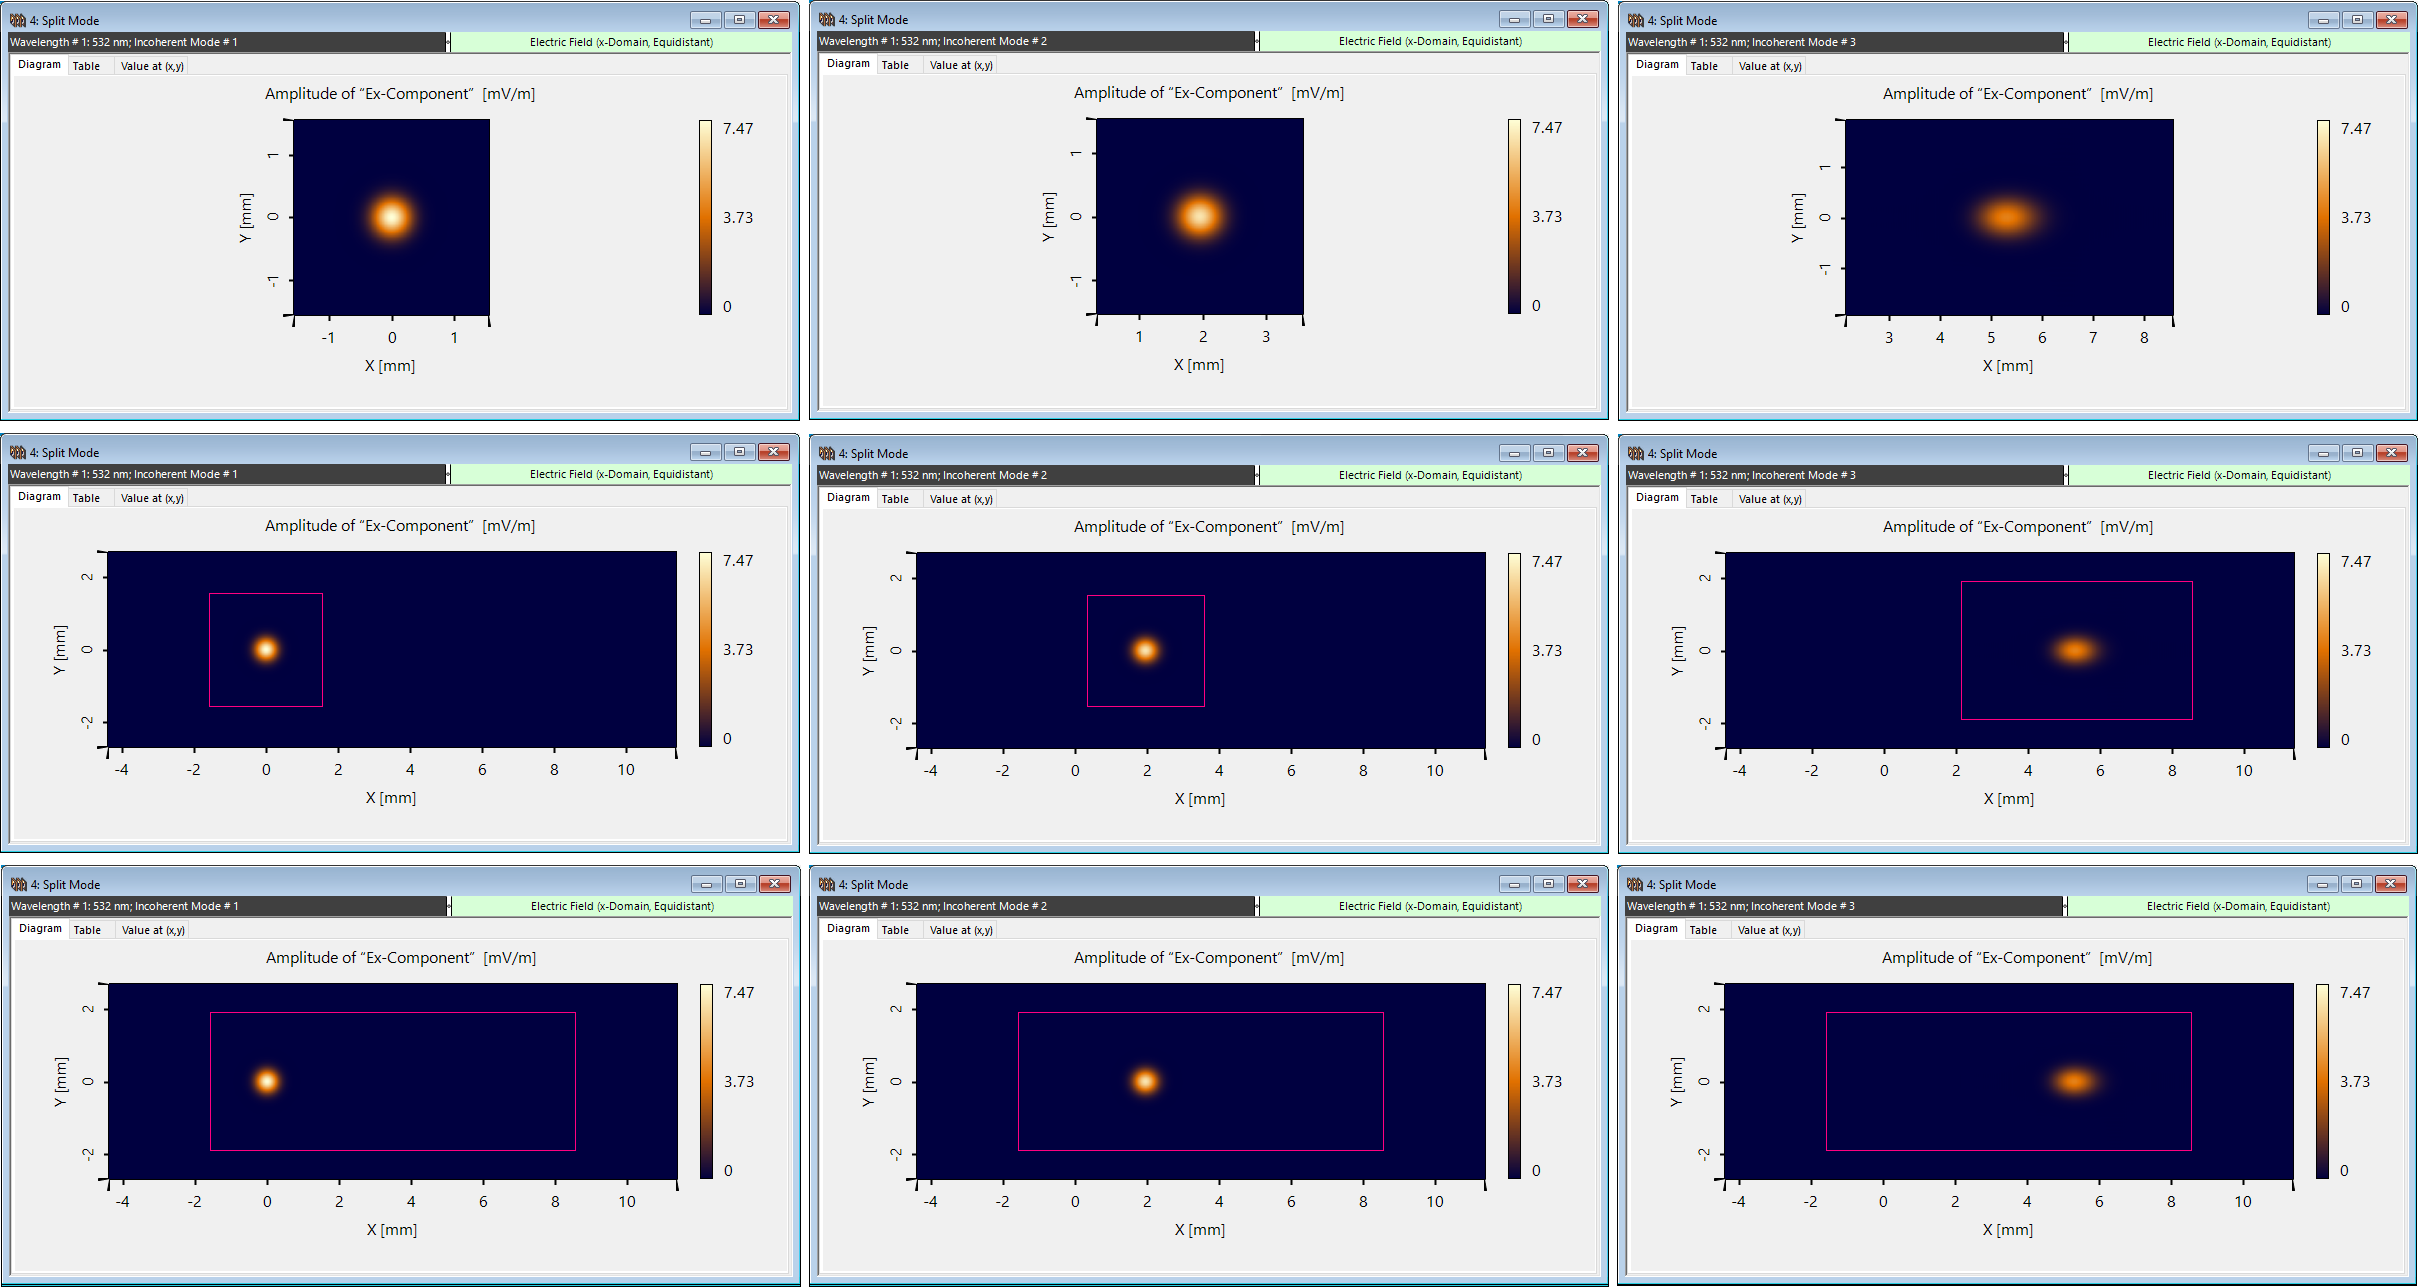
Showing Split Beam Profiles Separately
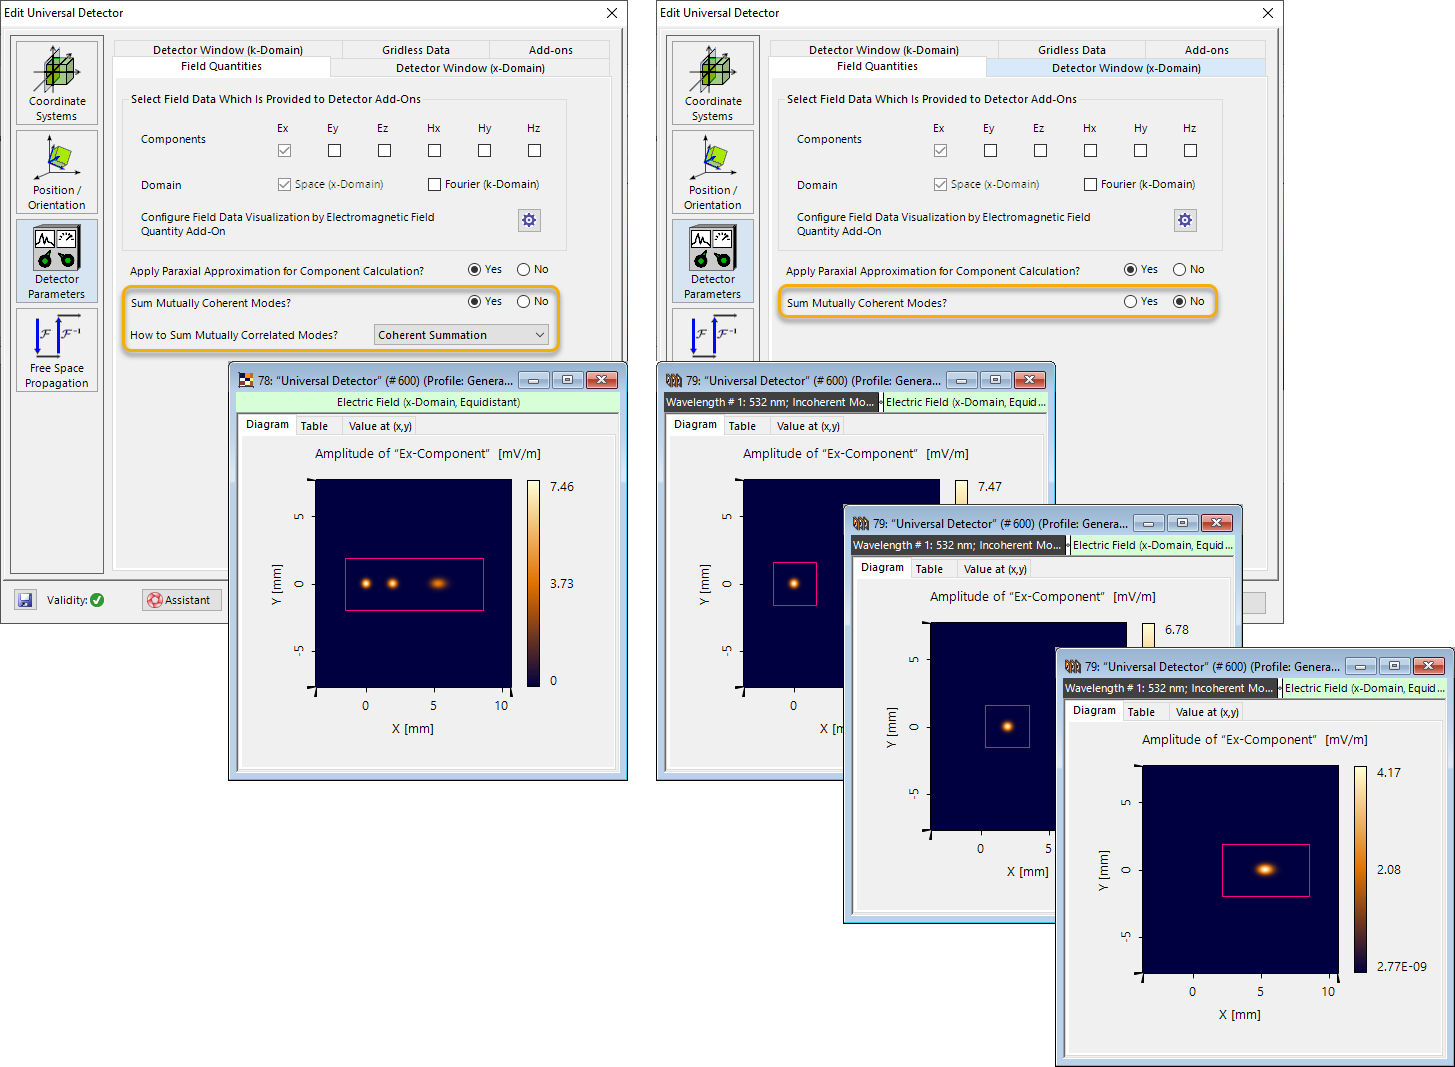
In optical scenarios where separate light modes are evaluated, the option to deactivate the Data Restricted Zoom can also be helpful to illustrate the differently handled modes’ data windows. Here, a divergent beam is split by an optical grating into three diffraction orders (figure 4). Sometimes you might want to regard these modes separately, maybe even incoherently (figure 5). This is all possible, and the option Data Restricted Zoom allows to show which data windows are generated for each mode (figure 6). Additionally, there is the option Unified Max Extension which allows the user to see the total area which contains all individual data windows.

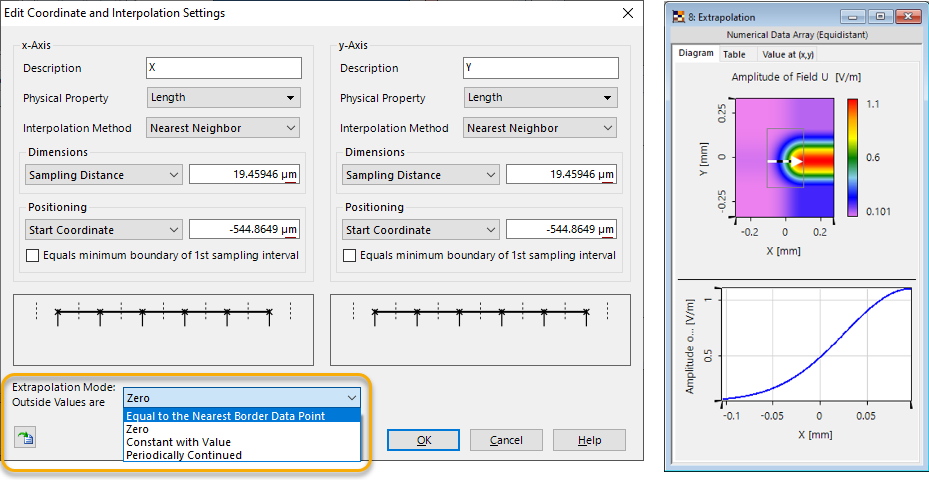
Check Which Values VLF Assumes for Extrapolation
Often data is shown with an interpolation. Such interpolation might yield unwanted effects at the border. To avoid this, VLF uses also extrapolation options, to be set via Manipulations > Coordinate and Interpolation Settings (figure 8). In this example, data is shown with the extrapolation mode “Equal to the Nearest Border Data Point”. After deactivating Data Restricted Zoom and outzooming, one sees the effect of this extrapolation setting.
Example:
Tutorial