Easier Use and Better Control in Data Visualization!
While the Distributed Computing Package and the Parameter Variation Analyzer certainly are the highlights of the latest release of the optical modeling and design software VirtualLab Fusion, 2023.2, we have also implemented a whole set of new features and improvements for our result and data visualization, allowing the user a clearer picture of what is going on in the optical system.
Hence, in this week’s newsletter we want to put the spotlight on two of these additions. Please take a look at the documents linked below to find a guide to our Ray-Results 3D System View, the perfect engine to provide a quick overview of how the system is set up and what the light propagation inside it looks like. With this latest release, we have added options to, for instance, filter out any rays that do not pass a specific aperture, as well as new ruler to easily measure distances in the view. The second document tells you all you need to know about how regions work in VirtualLab Fusion, including the multiple new tools to scale, rotate and shift regions.
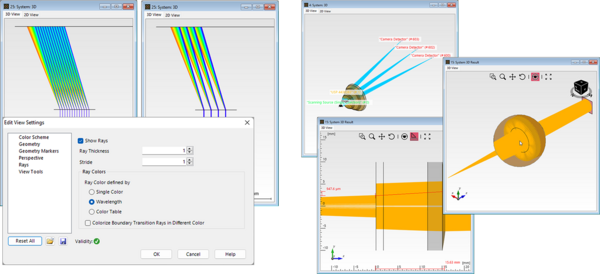
3D Visualization of the Optical System
VirtualLab Fusion provides tools which generate a 3D visualization of optical systems and can therefore be used to check the positioning of elements, as well as to get a quick overview of the light propagation inside the system.
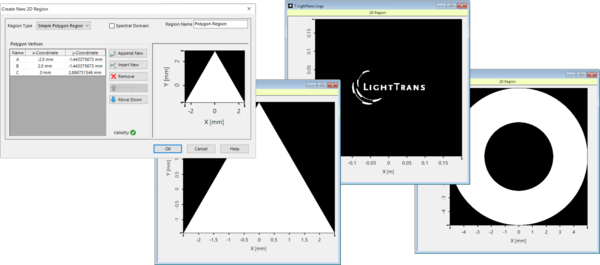
This use case walks you through the flexible configuration of regions in VirtualLab Fusion, which allow the user to define variously shapes for e.g., light-guide applications and definition of evaluation regions.