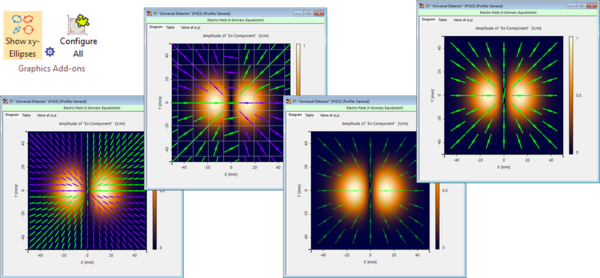
As light is much more than just power and flux, the full vectorial representation as an electromagnetic field is of interest for most modern optical applications where the polarization state of the light can be influenced by anything from gratings to refractive surfaces. In order to be able to account, not just for the polarization properties of the source, but also for the (potentially complex) evolution of the polarization state as the light propagates through the system, the latest release of the fast physical optics modeling and design software VirtualLab Fusion, 2023.1, offers the possibility of displaying the polarization state of the electromagnetic field as a graphical overlay directly on top of the field data. The so-called polarization ellipses are a common way to visualize the time-dependent path followed by the field vector in space. However, in non-paraxial systems, these ellipses exhibit in general a three-dimensional, locally varying behavior that is a far cry from the simplified global polarization in two dimensions that is typically covered in optics education. The gridded overlay provided in VirtualLab Fusion can easily describe any local variation of the polarization, and with the option to configure which cross section the displayed polarization ellipses refer to, the full three-dimensional path of the electric field vector can also be visualized.
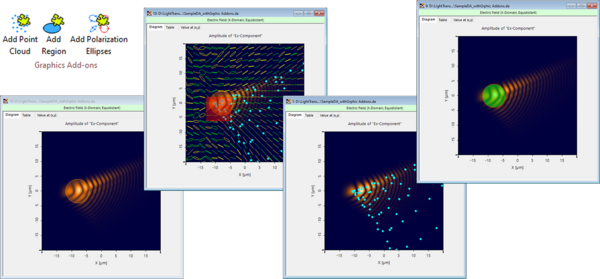
A detailed document about this feature, detailing its function and visualization options, can be found below. The technology behind this – Graphics Add-ons – is also used to easily superimpose other information onto the field. Examples of this could be a point cloud representing the dot diagram that corresponds to a given field result, or a region in which a detector is active, both of which can be overlayed onto the field data with a few clicks. An overview of the different uses of Graphic Add-ons can also be found in the documents below.
Polarization Ellipses
This Use Case shows how to visualize the polarization state of light, represented as complex electromagnetic wave in a depictive way.
Graphics Add-Ons are a tool inside VirtualLab Fusion that allows you to overlay information, such as point clouds, a specific region or polarization ellipses onto a detector result. This use case demonstrates how to do this.